Competitor Store Location Analysis
This tutorial will:
- Explore 2 store chains in Sacramento, CA
- Create drive-time catchments around each store
- Join catchments with census data (population, income)
- Determine which stores best reach target populations with minimal competition
This tutorial shows the prompts we use to build this analysis.
Since AI is non-deterministic, prompts may not always work identically. You might need to manually adjust prompts or code.
Consider prompts as starting points, not final answers.
Getting Data
We'll use these online datasets for this analysis:
- Starbucks point locations as our target stores. Available on Kaggle
- McDonald's point locations as our competitor stores. Available on Kaggle
- Census Data to get population and average income of the area around each store.
Starbucks & McDonald's locations
Ask the AI to write a UDF loading data from the Kaggle cURL API:
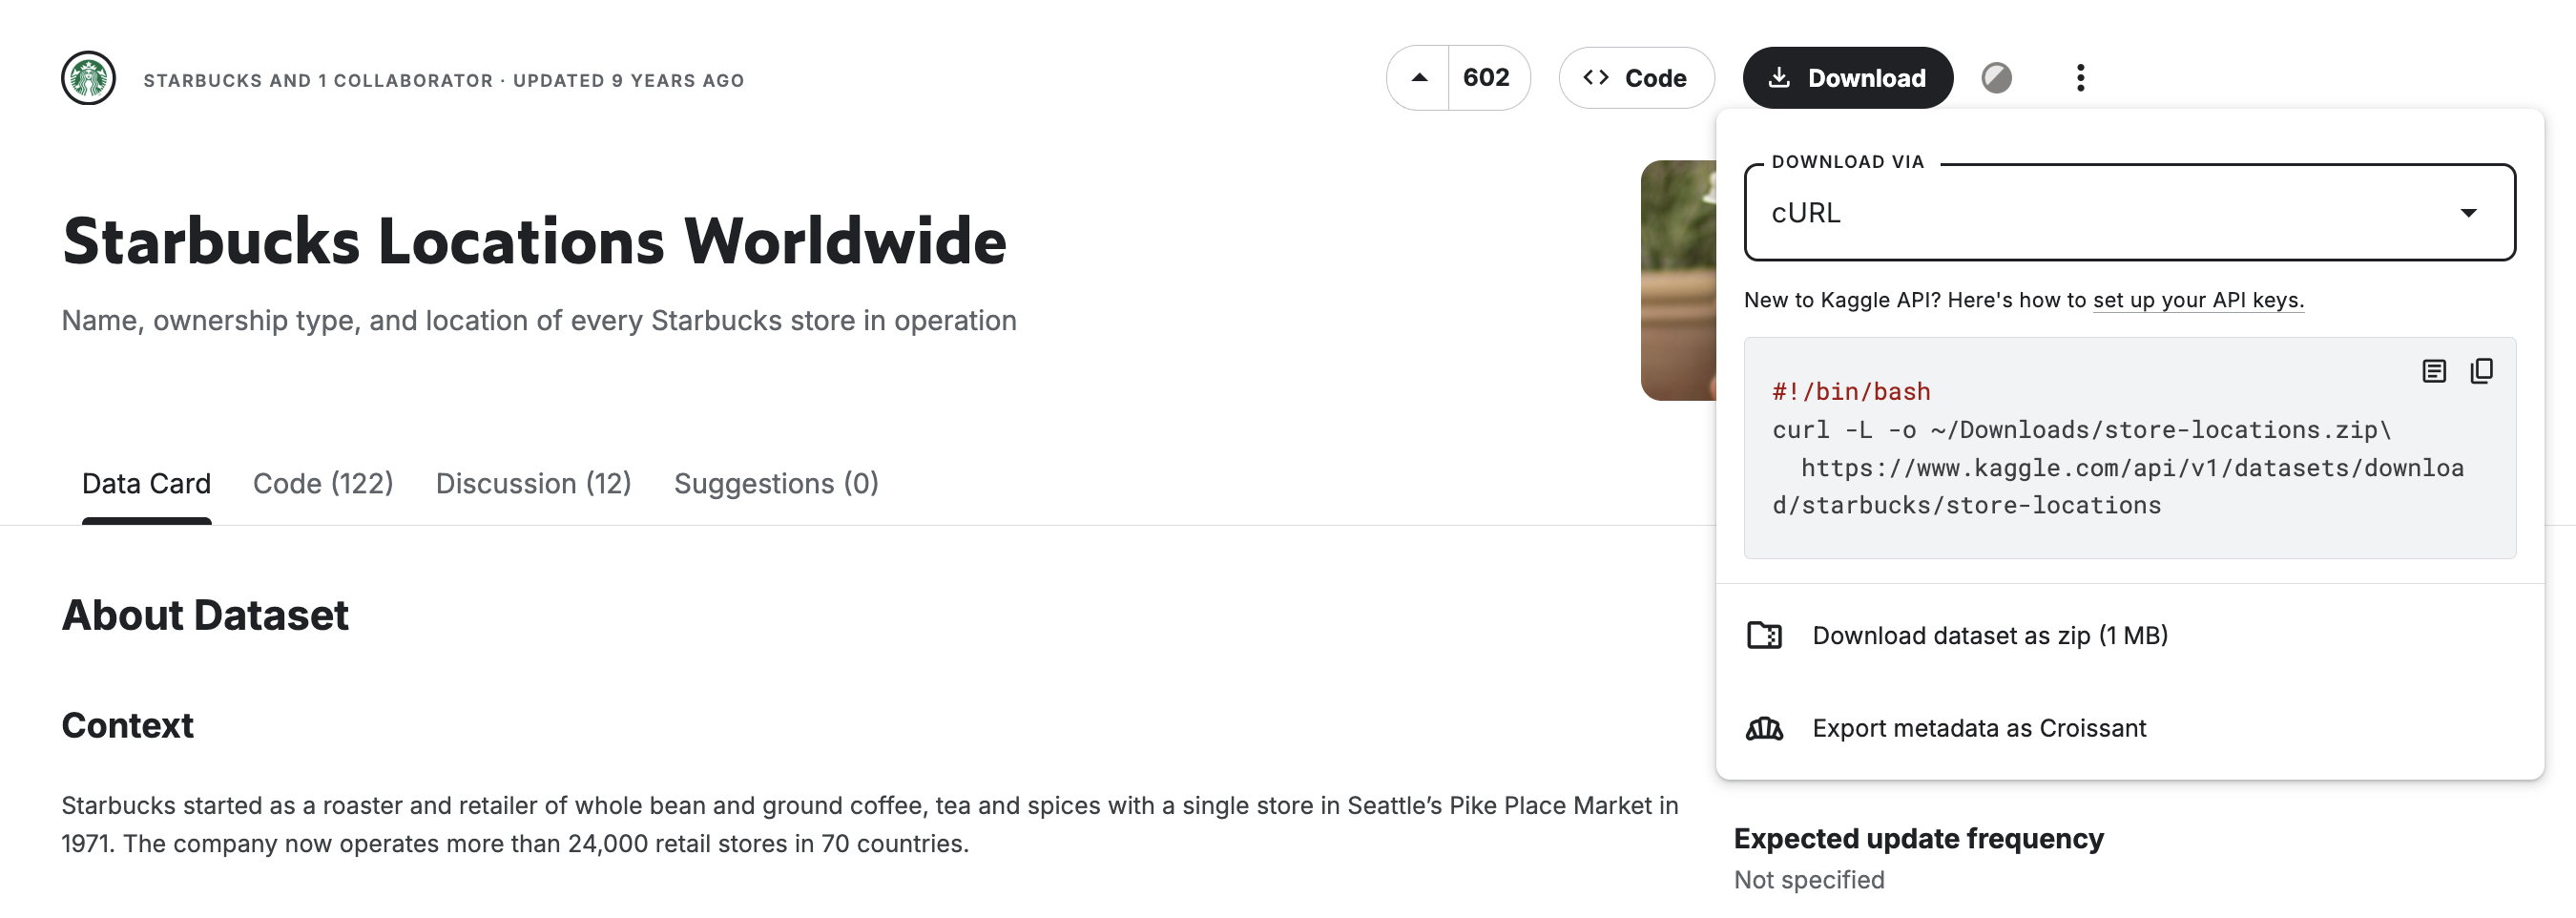
Open this specific dataset and return points as a dataframe based on this Kaggle curl request:

#!/bin/bash
curl -L -o ~/Downloads/store-locations.zip\
  https://www.kaggle.com/api/v1/datasets/download/starbucks/store-locations
To simplify this tutorial, we've pre-downloaded the data:
- Starbucks:
s3://fused-sample/demo_data/catchment_analysis/starbucks_location.pq - McDonald's:
s3://fused-sample/demo_data/catchment_analysis/mcdonalds_location.pq
Census Data
Get Census data from the official US Census website.
For simplicity, we've pre-downloaded Census Block Groups (BG) data:
- Sacramento, CA Census Block Groups:
s3://fused-sample/demo_data/catchment_analysis/acs_bg_ca_2022_sacramento_geoparquet.parquet
Exploring Data in Fused
Create 1 UDF per dataset to explore them as individual layers on the Map View.
Starbucks
Create a new UDF and ask the AI:
can you open this starbucks location file (s3://fused-sample/demo_data/catchment_analysis/starbucks_sacramento.pq) and return as geodataframe
McDonald's
Create another UDF and ask the AI:
can you open this macdonalds location file (s3://fused-sample/demo_data/catchment_analysis/mcdonalds_sacramento.pq) and return as geodataframe
Census Data
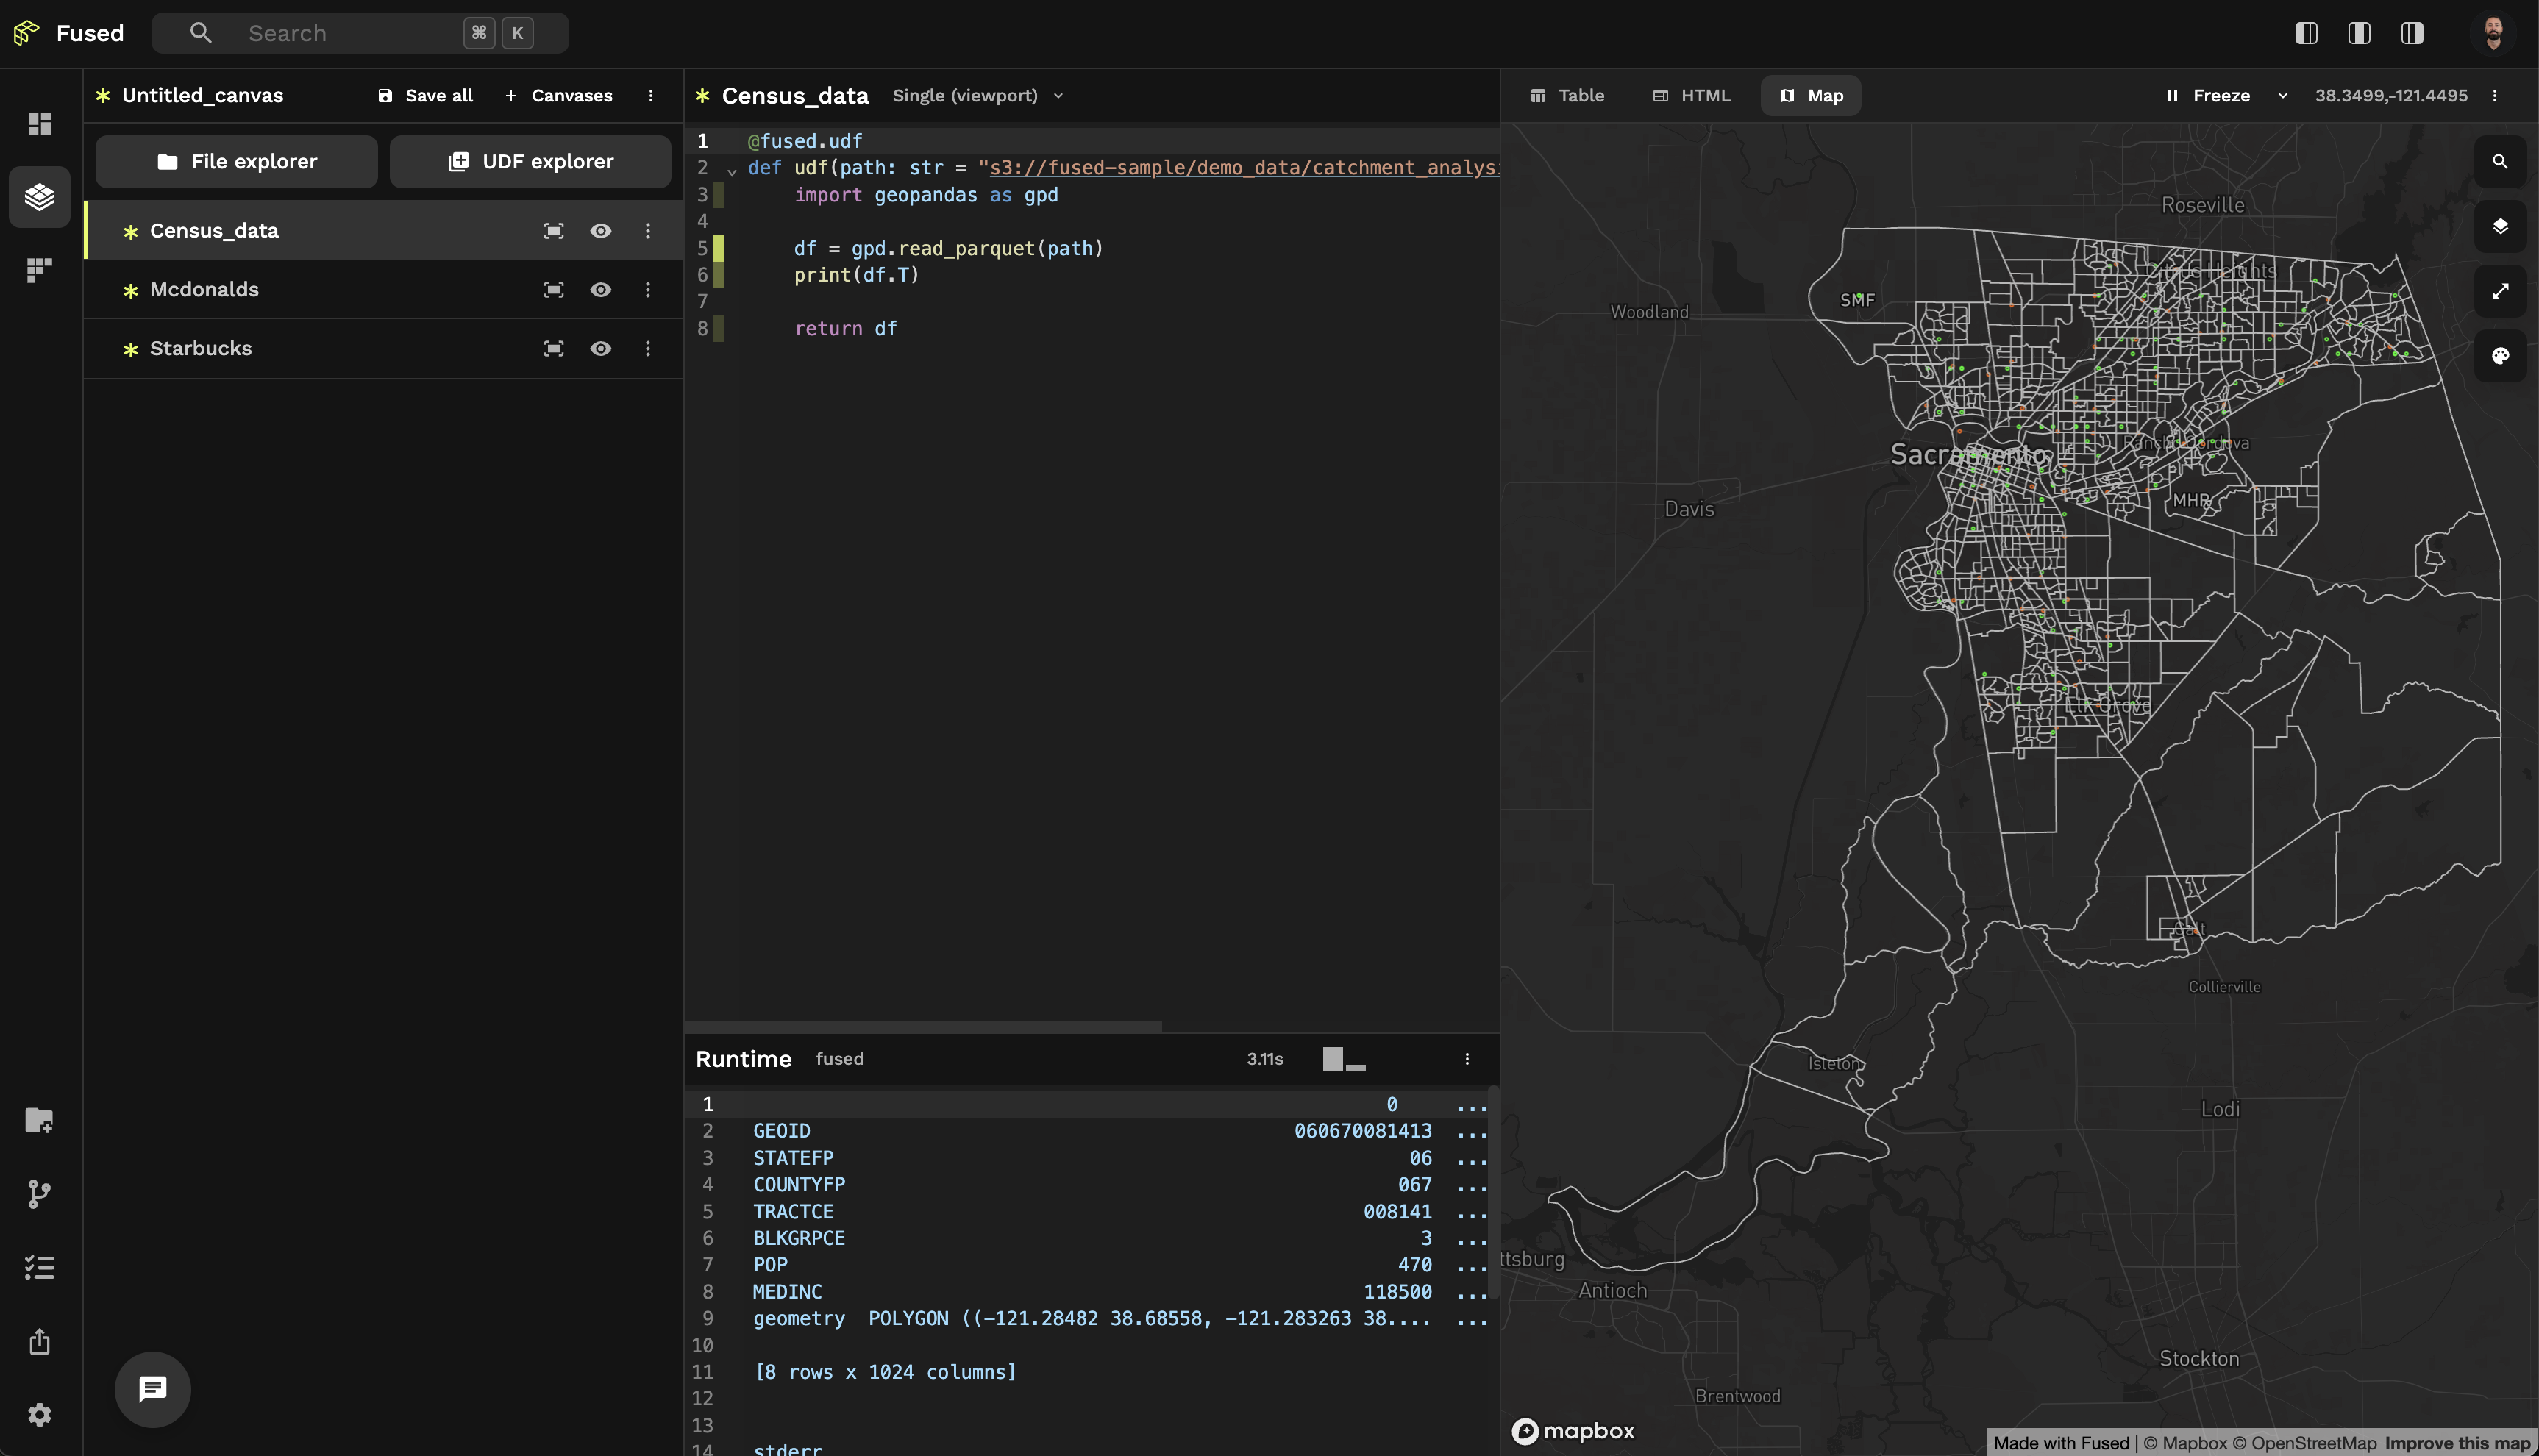
Create another UDF and ask the AI:
Can you open this file using geopandas as return df s3://fused-sample/demo_data/catchment_analysis/acs_bg_ca_2022_sacramento_geoparquet.parquet
After renaming each UDF and changing store colors in the Visualization Tab:
Visualization JSONs
You can copy paste these JSONs into the Visualization Tab to have similar colored stores:
Starbucks
{
  "vectorLayer": {
    "@@type": "GeoJsonLayer",
    "stroked": true,
    "filled": false,
    "pickable": true,
    "lineWidthMinPixels": 1,
    "pointRadiusMinPixels": 1,
    "getLineColor": {
      "@@function": "colorContinuous",
      "attr": "value",
      "domain": [
        0,
        10
      ],
      "steps": 20,
      "colors": "Mint",
      "nullColor": [
        2,
        250,
        1
      ]
    },
    "getFillColor": [
      208,
      208,
      208,
      40
    ]
  }
}
McDonalds
{
  "vectorLayer": {
    "@@type": "GeoJsonLayer",
    "stroked": true,
    "filled": false,
    "pickable": true,
    "lineWidthMinPixels": 1,
    "pointRadiusMinPixels": 1,
    "getLineColor": {
      "@@function": "colorContinuous",
      "attr": "value",
      "domain": [
        0,
        10
      ],
      "steps": 20,
      "colors": "Burg",
      "nullColor": [
        250,
        100,
        1
      ]
    },
    "getFillColor": [
      208,
      208,
      208,
      40
    ]
  }
}
Creating isochrones
The Fused AI Assistant uses other UDFs as inspiration to adapt existing code for new use cases.
We'll use the Get Isochrone UDF as AI inspiration. This UDF:
- Uses the Valhalla API to create drive-time isochrones around points
- Returns a GeoDataFrame with isochrone polygons
Perfect for our Starbucks analysis! We need:
- 15-minute drive time (
autocosting mode)
Since this API is slow, we'll break down the problem:
- Use
Get_IsochroneUDF for 3 points first - Validate isochrones look correct
- Manually increase API calls
Steps:
- Open the
Get_IsochroneUDF in Workbench (no copy needed) - Go to your
starbucks_locationUDF chat - Include
@Get_Isochronein your AI request for context
Ask the AI (in the chat for your starbucks_location UDF):
Use @Get_Isochrone to create 15-minute driving isochrones around each starbucks location.

Test this out with just 3 points first so we make sure this is working correctly at first
You'll see 3 isochrones on the map:
You can manually increase the API calls if desired. For simplicity, we provide the output file:
s3://fused-sample/demo_data/catchment_analysis/starbucks_isochrones_15min.pq
Joining catchments & census data
Next, we'll:
- Take each store's 15-minute catchment polygon and find intersecting block groups
- From intersecting BGs, compute catchment metrics:
- Population sum inside catchment
- Median income
- Block group count (number of intersecting BGs)
In a new UDF, ask the AI:
Write a UDF that intersects each store’s 15-minute catchment polygon (from catchment_udf) with Sacramento block groups.
For each store, use gpd.overlay to compute:
- Total population (sum across intersecting block groups)
- Median household income (median of intersecting block groups)
- Block group count (distinct GEOIDs touched)
Aggregate results per store into a clean summary table and return that.

The block groups for sacramento are here: `s3://fused-sample/demo_data/catchment_analysis/sacramento_block_groups.pq`

The starbucks catchments are here: `'s3://fused-sample/demo_data/catchment_analysis/starbucks_isochrones_15min.pq'`

use 4326 projection for all
Return the catchment geometries so I can still visualize the gdf on a map
Competitor Analysis
In the same UDF, ask the AI for competitor analysis:
Enhance the catchment UDF to measure competition:
- Load McDonald’s store locations from
  `s3://fused-sample/demo_data/catchment_analysis/mcdonalds_sacramento.pq`.
- For each Starbucks 15-minute catchment polygon, count how many McDonald’s points fall inside (point-in-polygon).
- Add this as a new column `Competition` to the per-store summary table.
How many mcdonalds (competitor to starbucks in this case) are present in each catchment?
Track how many of our own stores are in each catchment:
Enhance the catchment UDF to measure cannibalization:
- Load Starbucks store locations from
  `s3://fused-sample/demo_data/catchment_analysis/starbucks_sacramento.pq`.
- For each Starbucks 15-minute catchment polygon, count how many *other* Starbucks points fall inside (exclude the store itself).
- Add this as a new column `Cannibalization` to the per-store summary table.
Ranking stores
Rank stores based on:
- Highest catchment population
- Highest median income
- Lowest competition
- Lowest cannibalization (i.e. number of our own stores)
So let's ask the AI:
Based on all the info here, give me a ranking of which stores I should invest in the most. I care about starbucks stores that have:
- The highest income
- Highest population
- Least amount of competitors
- Least amount of cannibilization

Create a ranking formula for Starbucks stores based on these criteria
Ask the AI to plot a chart. When your UDF returns a dataframe, AI chat suggests chart creation:
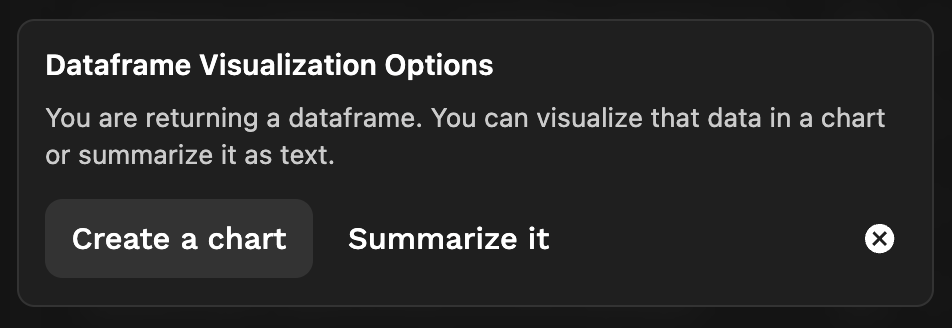
This visualizes the results:
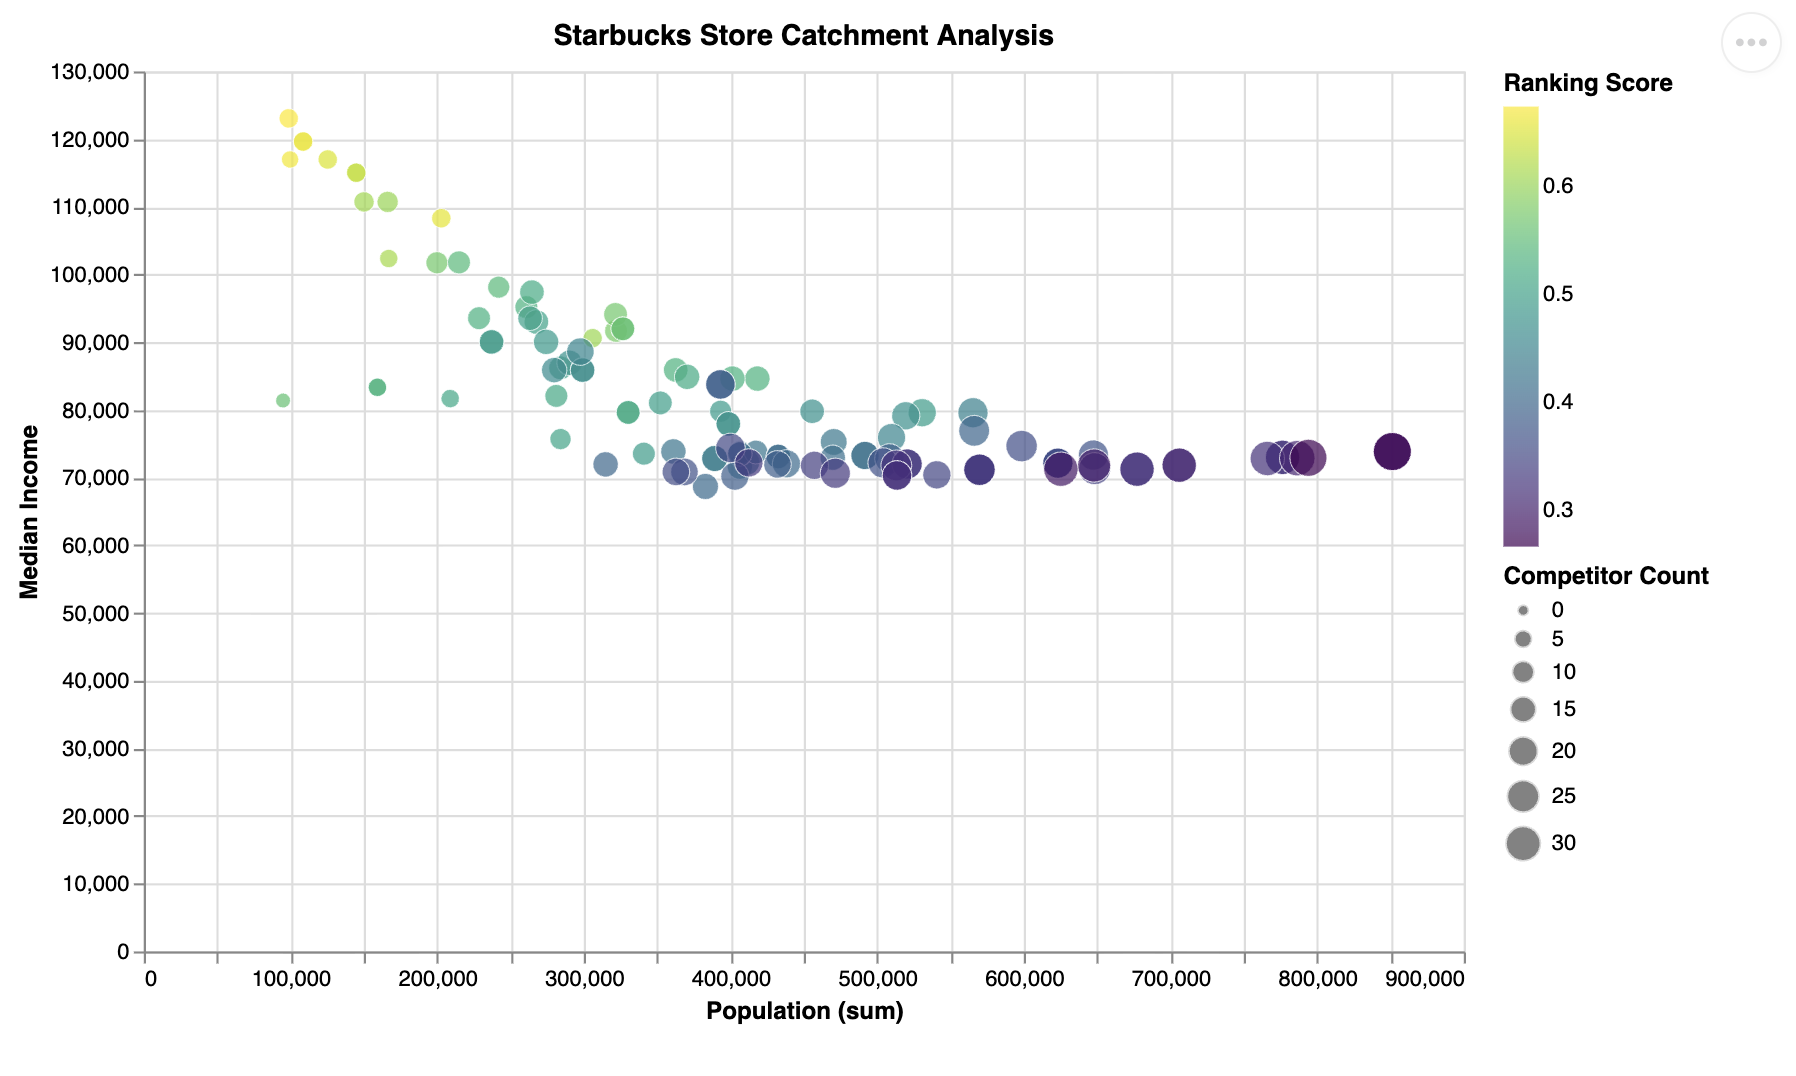
The AI ranking shows top stores have:
- Highest income
- Lowest population
Since all AI output is Python code, you can examine and fine-tune the ranking logic!
Next Steps
Improvement ideas:
- Fine-tune ranking, drive times, etc.
- Add more data sources
- Scale to entire US using
fused.submit()